
You hear a lot of discussion about predictive metrics these days. In fact, college basketball analysts and bracketologists seem to use predictive metrics more and more each year when debating NCAA Tournament projections.
Last week, I gave you some history behind the metrics and how they came to have an increased usage in the selection process. Today, I will explain how the use of these metrics is misunderstood by the public — and even some bracketologists.
As I previously mentioned, the three metric systems seen on the NCAA selection committee team sheets are KenPom, BPI and Sagarin. Ten years ago, these predictive metrics were rarely used by the committee to help them pick or seed teams, but since then, the committee has paid closer attention to these popular metrics.
Many fans think that the committee heavily relies on these metrics — that’s just not true.
They use them in conjunction with all the other information on the team sheet that includes record, road record, overall and non-conference strength of schedule, Q1 and Q2 wins, high-quality wins, bad losses, injuries and any other external factors that come into judging a team’s performance.
Some even think that when the committee seeds teams they almost exclusively use predictive metrics. Again, this is not correct. This idea was born by some bracketologists who think they have “cracked the code” and who, by using mostly predictive metrics to seed teams, have found they match what the committee’s final decisions are when it comes to seeding teams.
The NCAA continues to communicate that when seeding teams for the NCAA Tournament, they use the same procedures and look at the same information that they do when they bring schools into the field.
I am not in any way against using predictive metrics to help you place or seed a team in the tournament. It is also possible that by using your numbers, you could come to the same conclusion as the committee. This can be explained by the fact that important data like strength of schedule and road performance — categories the committee focuses on — are baked into predictive metrics, which in turn are baked into the NET rankings.
Using predictive metrics as the committee does will ultimately help you become a more accurate bracketologist.
Make sure and follow me on Twitter @tkbrackets to get reaction to the college basketball season.
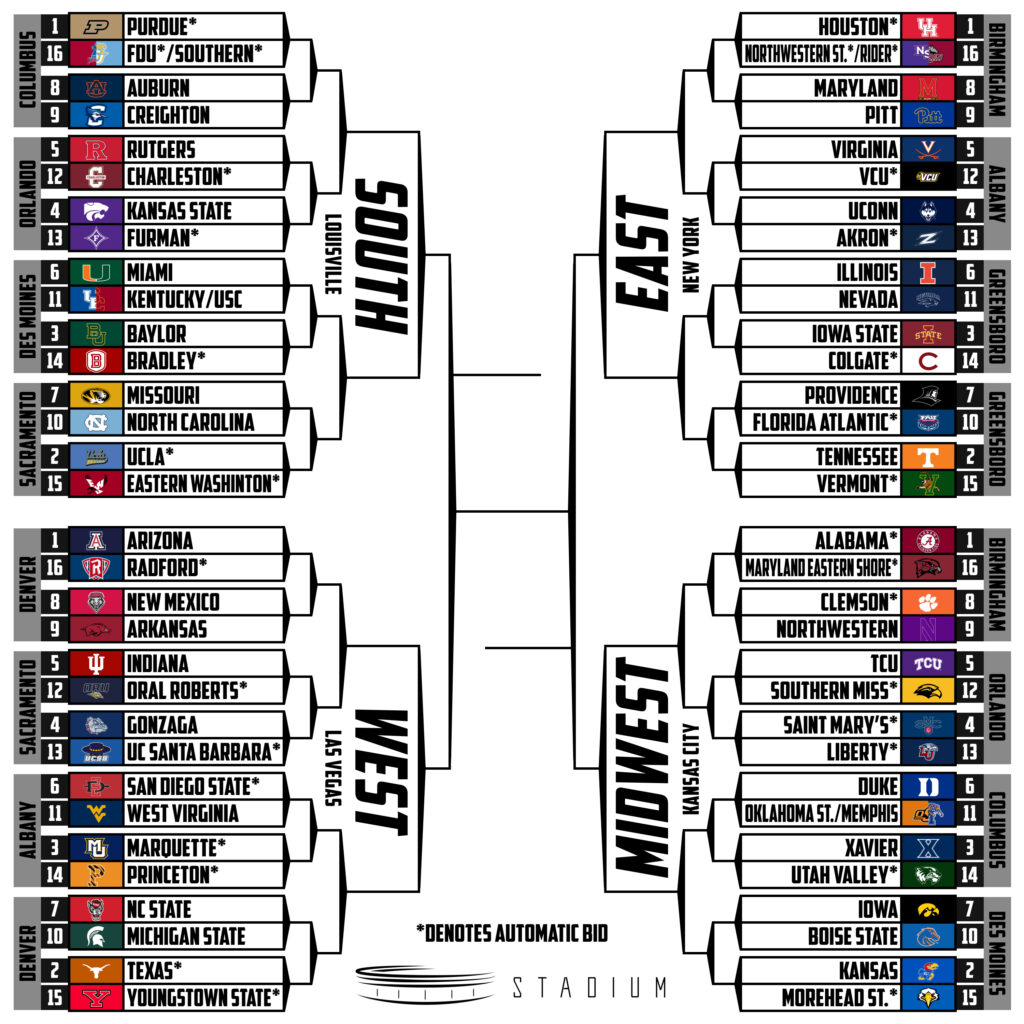
LAST FOUR IN: Memphis, Oklahoma State, USC, Kentucky
FIRST FOUR OUT: Mississippi State, Seton Hall, Texas A&M, Virginia Tech
NEXT FOUR OUT: Arizona State, Utah State, Wisconsin, Penn State
CONFERENCES WITH MULTIPLE BIDS
Big Ten: 8
Big 12: 8
ACC: 7
SEC: 6
Big East: 5
MW: 4
Pac-12: 3
AAC: 2
WCC: 2